The DecisionNext Finished Goods Index Report | March 2026

Published: March 9, 2026
Key Insights
- January indices reset slightly below the 2025 baseline across Cheeseburgers and Hot Dogs
- Chicken Sandwich remains deeply discounted versus last year.
- Forecasts point to firming across all three finished goods through May with Hot Dog Index cooling off into the summer months.
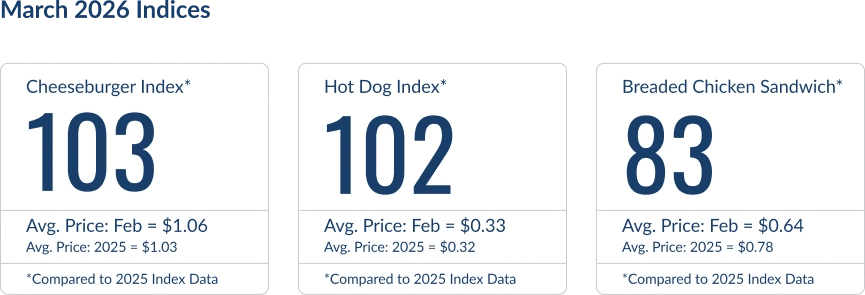

Figure 1 - With Cheeseburger steady, Hot Dog elevated, and Fried Chicken Sandwich correcting sharply, DecisionNext now provides full cross-protein insight.
Broad-Based Firming Into Spring
The next three months show a coordinated move higher across beef, pork, and poultry as all three finished goods indices climb into April and May. The key signal for procurement and pricing teams is not today’s level — it is the coordinated change in direction.
Seasonality Context: Where We Are in the Annual Cycle
The Finished Goods Index is calculated by comparing a single month’s price (either observed or forecasted) with the average price from the prior year. Because last year’s averages were influenced by significant seasonal spikes, an index value below 100 does not necessarily mean prices are down year-over-year.
In fact, the year-over-year charts add important context.
![]()
The Cheeseburger showed a distinct summer peak in 2025 reaching all time highs and materially lifting the full-year average. As a result, even though the Cheeseburger Index was at 98 in January before climbing to 103 in February. The unit price of a cheeseburger is approximately 10% higher year over year in the first two months of 2026 (Fig. 2).
By May, we forecast that year-over-year price growth could exceed 16% as seasonal tightening builds into late spring.
This dynamic underscores the importance of understanding the baseline: the index reflects positioning versus last year’s elevated average, not absolute price softness.

Figure 2 - Cheeseburger price history and 6-month forecast.
![]()
Hot Dogs experienced a pronounced spike between May and July last year, which, similar to the cheeseburger, buoyed the 2025 average.
In January 2026, the Hot Dog Index sat at 98, and yet the unit price was roughly 10% higher year-over-year (Fig. 3). Looking ahead, we forecast that year-over-year gains could approach 20% by May before prices cool back below 2025’s extreme summer highs.
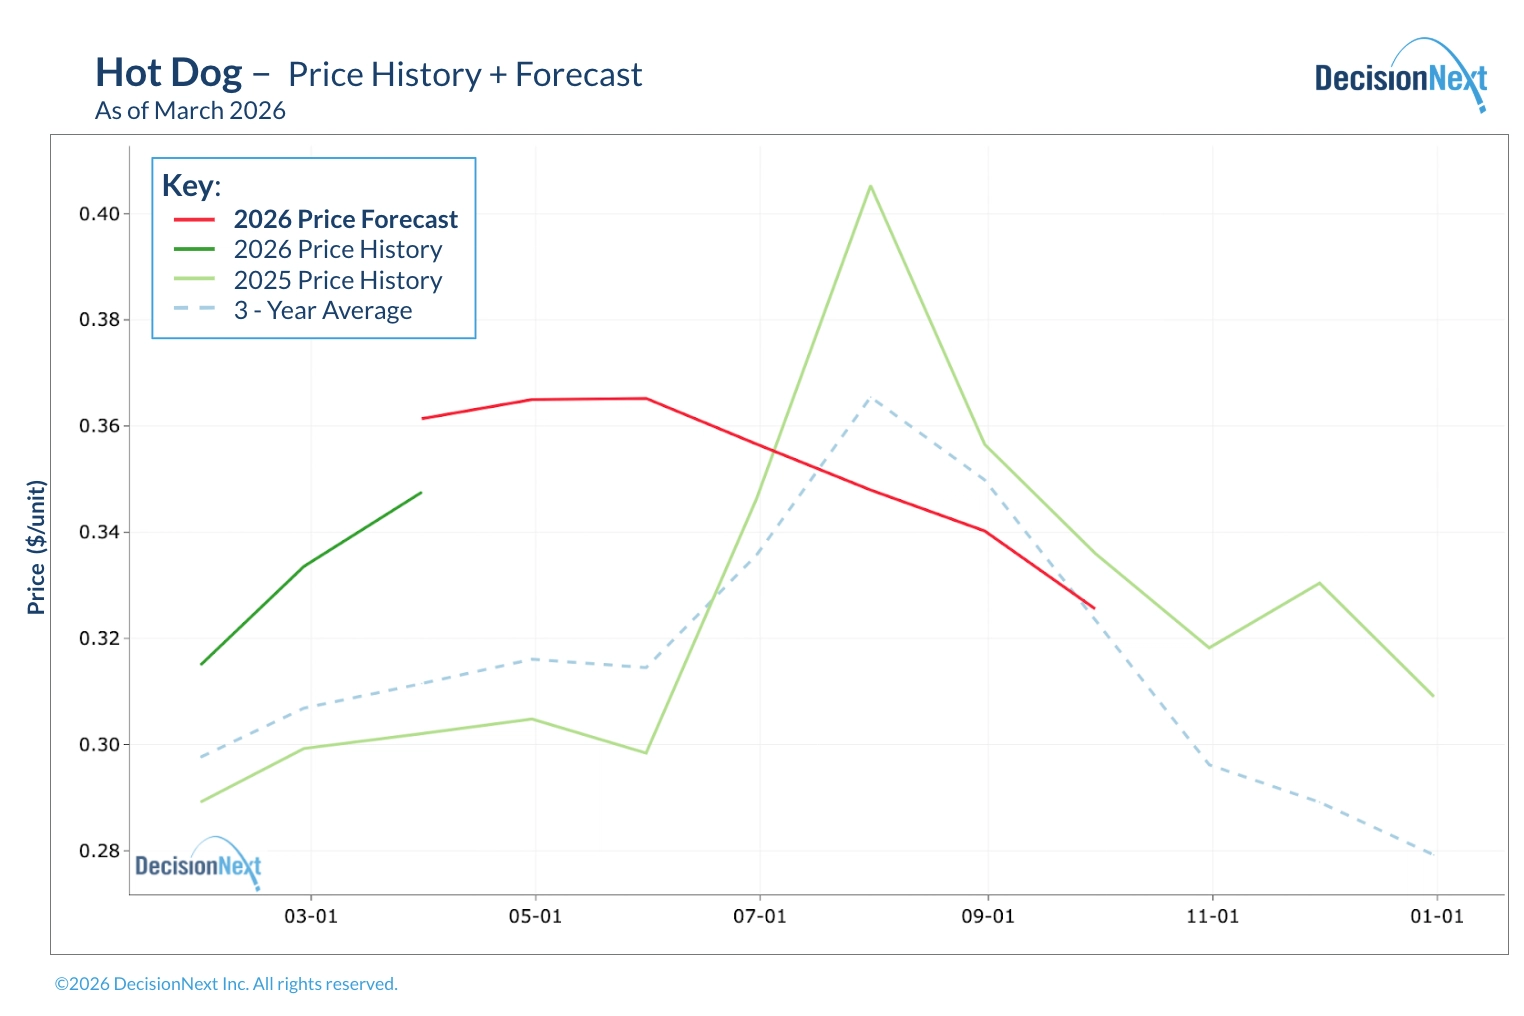
Figure 3 - Hot Dog price history and 6-month forecast
![]()
The Chicken Sandwich index value sat at 83 in February (Fig. 1). Again, one must look to the elevated prices in the summer of 2025 for context. Last July, the unit price of a chicken sandwich rose to $1.05 marking more than a 20% price increase over the 3-yr average (Fig 4).
In January 2026, unit pricing was down approximately 9% year-over-year. And even with a steady forecasted rise through spring, we are forecasting the unit price of a chicken sandwich to be down as much as 30% year-over-year in May due to the extreme highs reached during 2025. When compared to the 3-year average, May pricing is projected to be down over 15%, a trend which could reverse by July.
This contrast highlights how elevated last year’s spike was — and why the current recovery should be interpreted as normalization from an inflated base rather than renewed cost pressure.

Figure 4 - Chicken Sandwich price history and 6-month forecast.
Direction, Drivers, and Decision-Making
February marks a transition point. January’s reset placed beef and pork finished goods near baseline levels, while poultry remained deeply discounted. The forward view now signals coordinated firming across all three products into spring.
What matters most is not just the direction of the indices, but the drivers beneath them. As prior reports have demonstrated, single ingredients can dominate finished goods movement. Trim dynamics can quickly pressure the Hot Dog basket. Poultry inputs transmit rapidly through the Chicken Sandwich index. Beef cycles steadily influence the Cheeseburger. The rebuilding pressure visible in the forecasts suggests tightening at the ingredient level is beginning to cascade upward.
For operators, the implication is clear: the environment is shifting from stabilization to gradual cost rebuilding. Procurement teams should focus on directional signals rather than waiting for index values to cross arbitrary thresholds. Menu and promotion strategies may still benefit from poultry’s relative affordability, but the discount window appears to be narrowing. Cross-protein positioning will matter as relative value gaps begin to close.
The Finished Goods Index is designed to make these transitions visible early. It is not simply tracking cents per unit; it is identifying when ingredient volatility is poised to move through the system. February does not signal a return to last year’s extremes. It does signal that spring pressure is rebuilding — steadily and across proteins — and that coordinated movement is the real story.
Want to see the data behind this forecast or run your own analysis? Connect with DecisionNext or access the platform today.
About the Report
The DecisionNext Finished Goods Index showcases multi-commodity finished goods cost forecasting across protein, dairy, grain, and ingredient markets (see full methodology page).
By comparing current values to the average value from 2025, it helps stakeholders visualize real-time and forward cost pressures and profit opportunities across value-added food products. The tool enables users to forecast finished-good costs, adjust recipes, and analyze forward-looking scenarios.