The DecisionNext Finished Goods Index Report | December 2025

Published: December 9, 2025
Key Insights
- Breaded Chicken Sandwich Index: 77 | Price: $0.56
- Cheeseburger Index: 115 | Price: $1.03
- Hot Dog Index: 111 | Price: $0.33
- Poultry: Chicken breast fell from $2.76/lb in June to $1.14/lb in November, driving a 49% drop in sandwich cost
- Forecast: Modest firming is expected across proteins into early 2026, while staying below 2025 highs
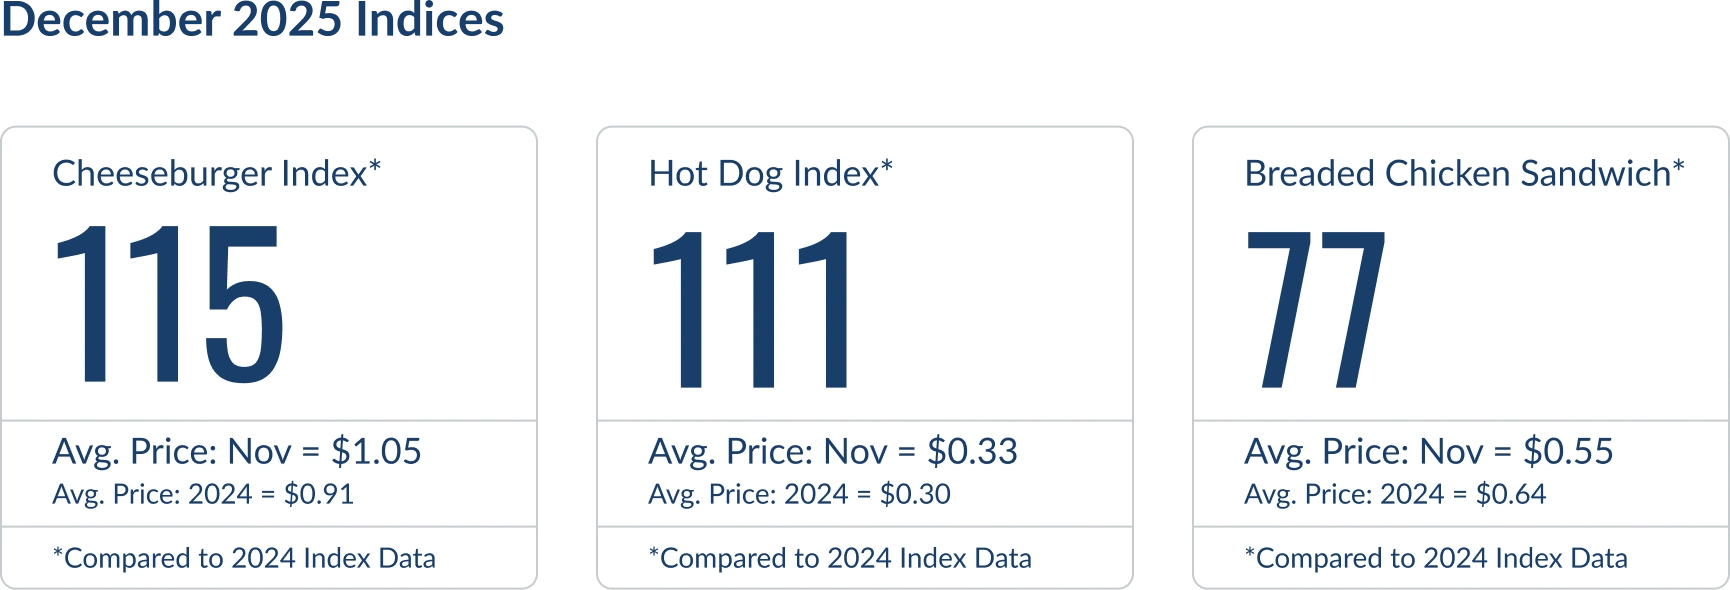
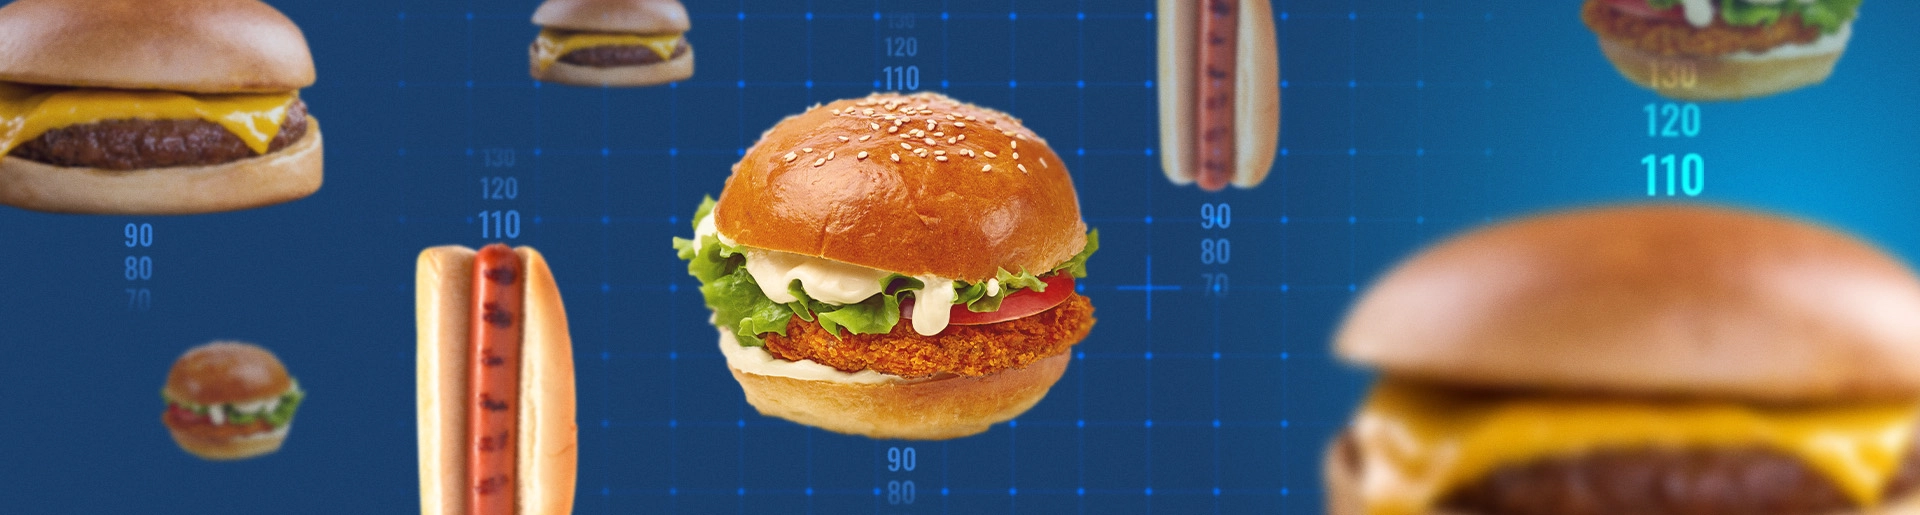
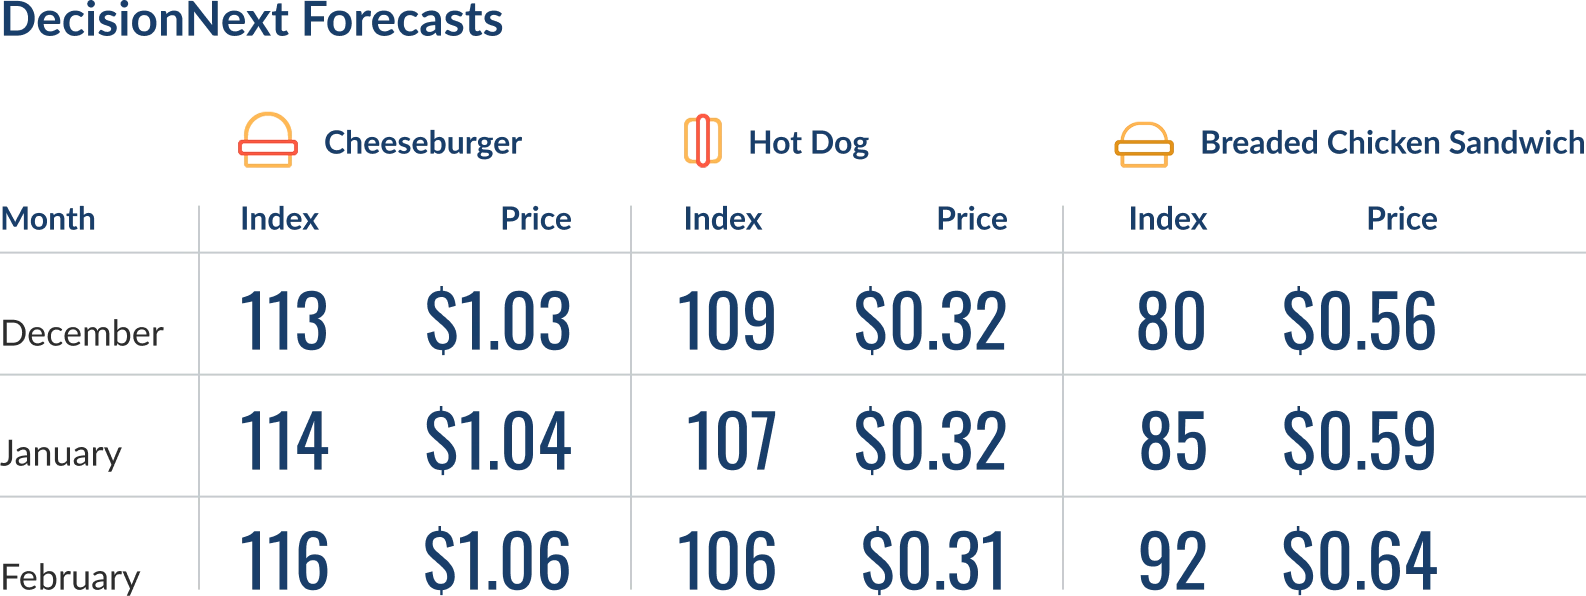 Figure 1 - With Cheeseburger steady, Hot Dog elevated, and Breaded Chicken Sandwich correcting sharply, DecisionNext now provides full cross-protein insight.

A New Benchmark Takes Flight
This month, the DecisionNext Finished Goods Index gets a major upgrade with the release of the Breaded Chicken Sandwich Index. Built on the same robust methodology, with history back to 2010 and a six-month forward forecast, this index adds a new lens into one of the fastest-growing categories in food.
Why now?
Across the value chain, teams continue navigating volatility in poultry, grains, and vegetable oils. The Breaded Chicken Sandwich combines these markets into a single benchmark. With inputs like boneless skinless chicken breast, hard red winter wheat, and soybean oil, the index offers a clear view of how input cost pressure flows into a modern QSR staple.
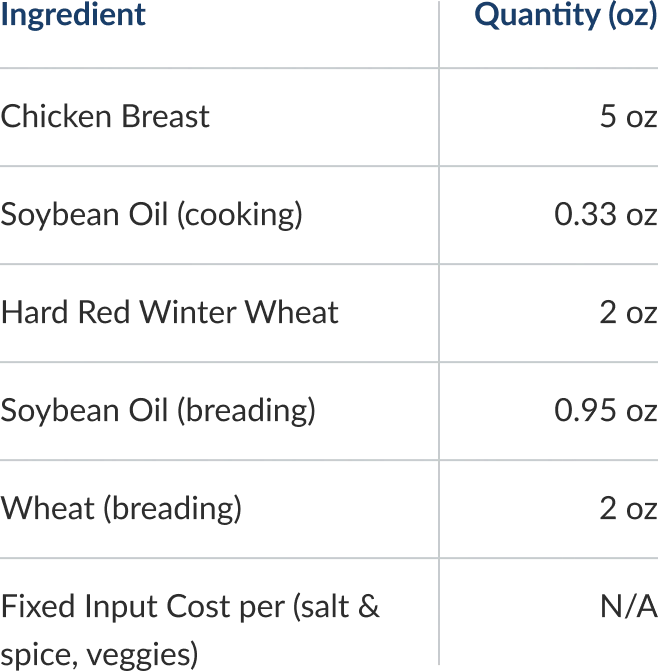 Figure 2 - Breaded Chicken Sandwich recipe used for the DecisionNext Finished Goods Index.
The Breaded Chicken Sandwich expands the FGI suite into poultry. With Cheeseburger and Hot Dog already reflecting red meat pressure dynamics, poultry adds a broader and more diversified view of finished goods economics across the full protein complex.
Deep Dive: Understanding the 2025 Poultry Whiplash
The Breaded Chicken Sandwich Index debuts as poultry markets have experienced one of their sharpest swings in recent years.
Through spring and early summer 2025, boneless skinless breast prices surged above historical norms as restaurant and retail promotions collided with a tight spot market. Broiler meat remained the most-consumed U.S. protein, beef prices stayed historically elevated, and breast availability was thin coming out of winter.
By May, breast prices reached $2.76/lb, roughly $0.75 above the five-year seasonal average.
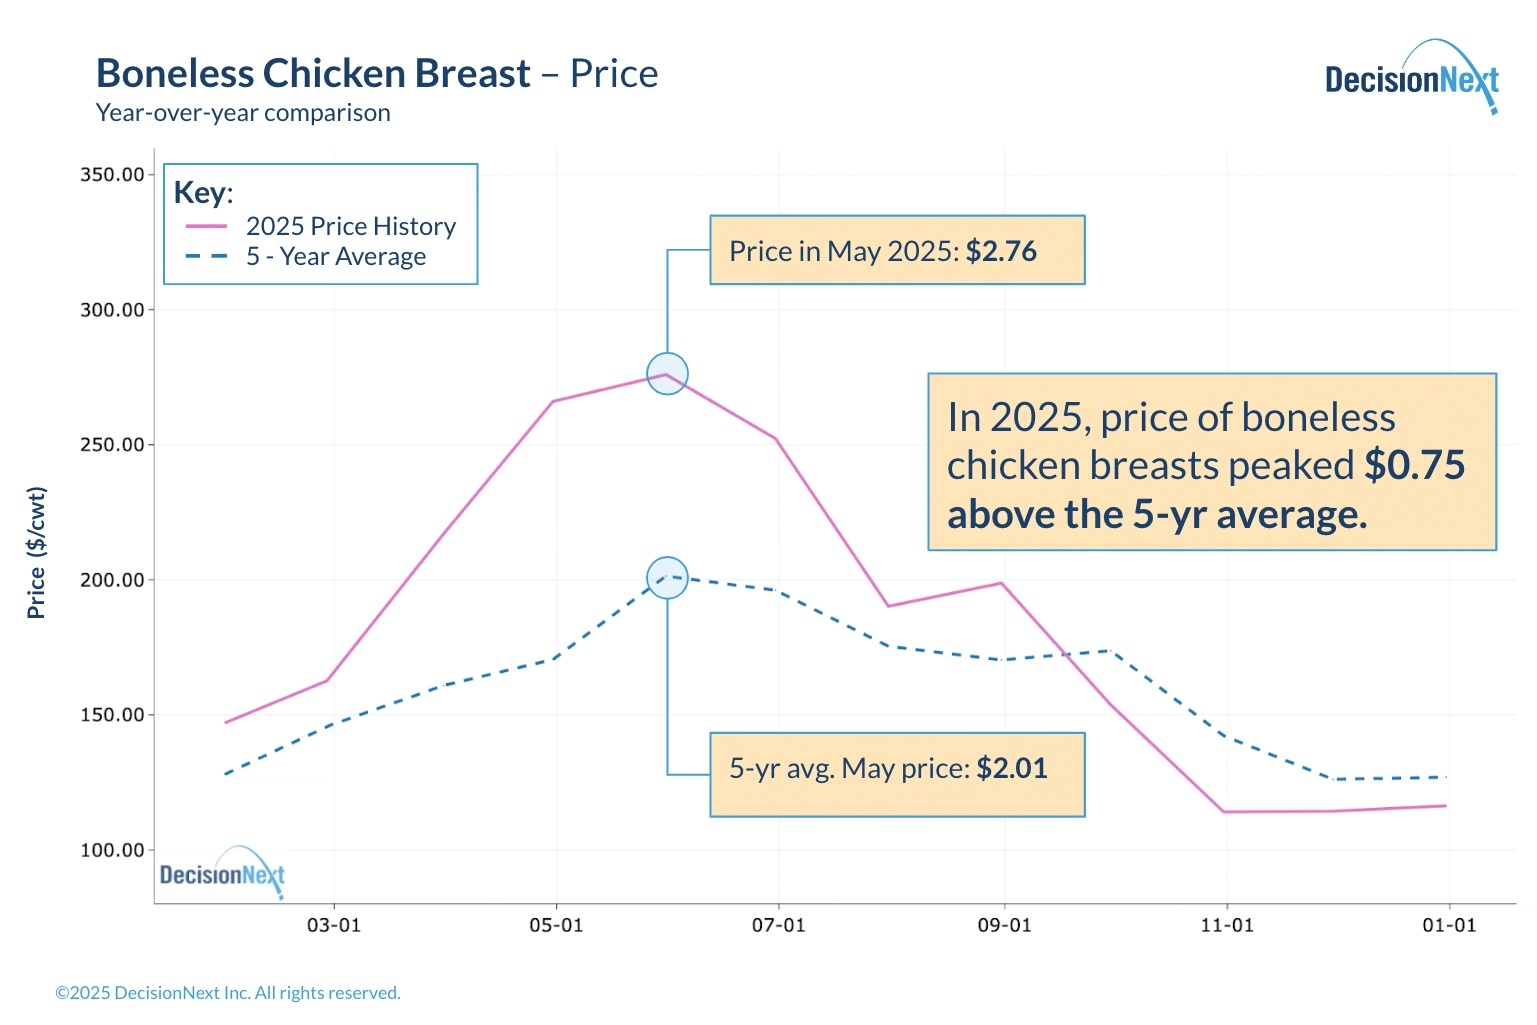 Figure 3 - Boneless chicken breast year-over-year price comparison.
At that point, chicken breast alone contributed $0.86 of the total $1.05 sandwich cost, showing just how sensitive this finished good is to poultry fundamentals.
By mid-summer, dynamics shifted. Earlier chick placements moved through plants, bird weights increased, inventories rebuilt, and promotional pulse faded. As supply caught up with demand, breast prices retreated steadily, falling to $1.14/lb by November.
That took the breast component down to $0.36, compressing overall cost structure. The finished-good impact was significant: the sandwich dropped from $1.05 in June to $0.54 in November, nearly 49% in five months.
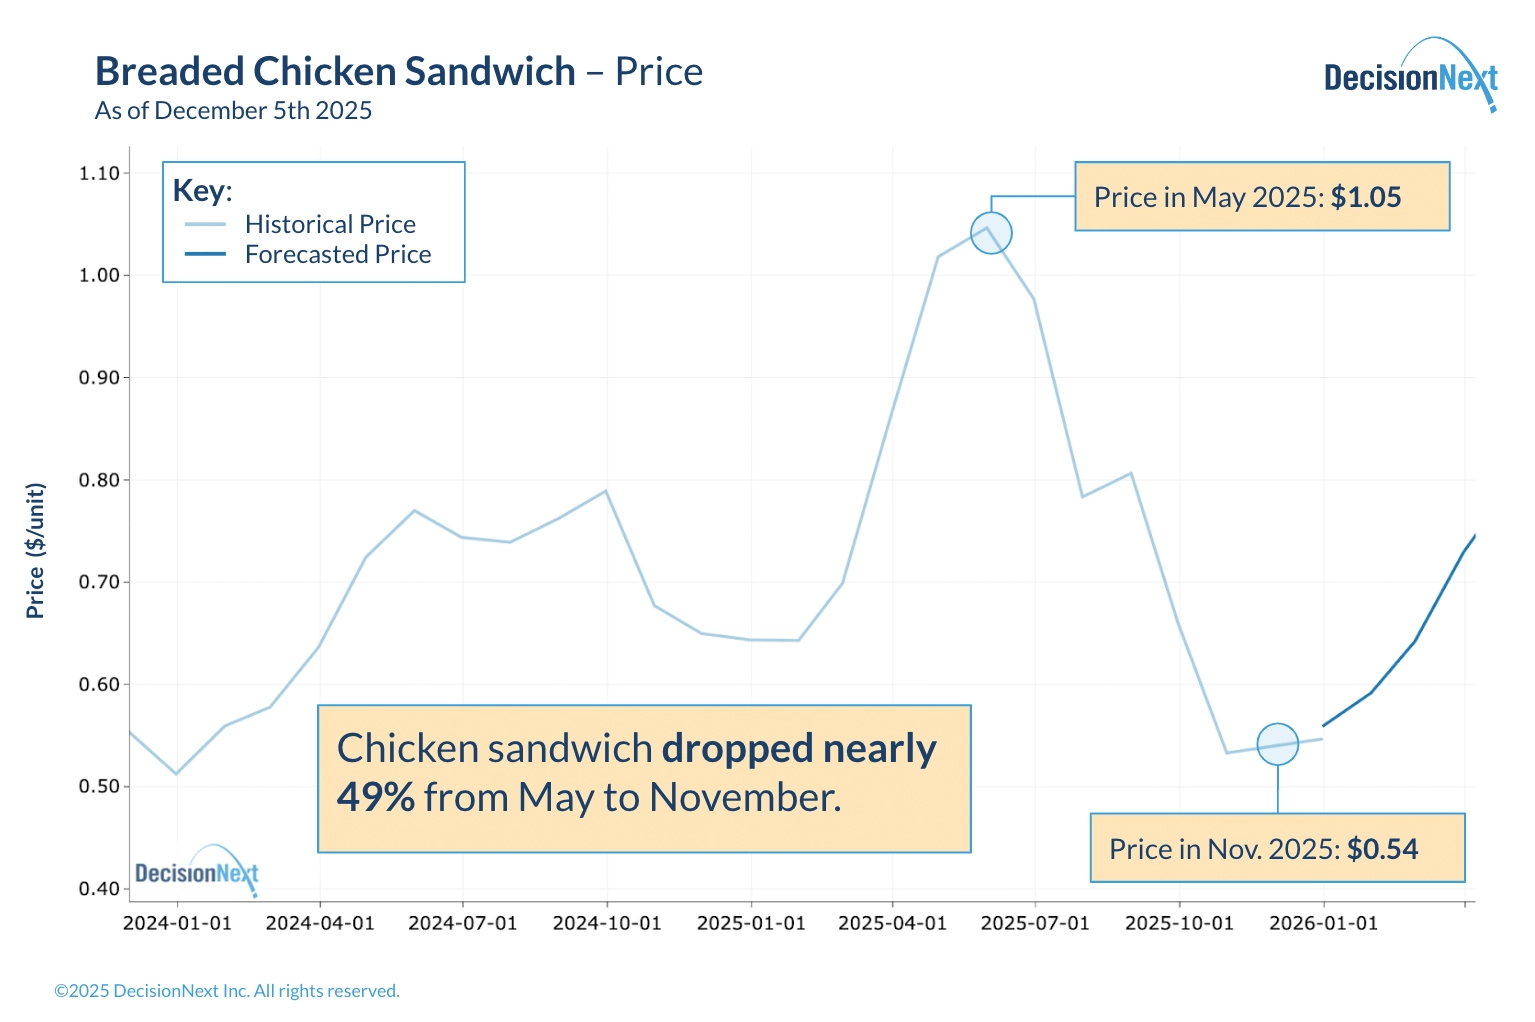 Figure 4 - Breaded chicken sandwich price history and forecast.
Looking ahead, the model forecasts a gentle rebound in early 2026 as seasonal demand normalizes. Even with the rebound, projected values remain well below last spring’s highs.
What It All Means for You
The December 2025 FGI marks an important step forward as the Breaded Chicken Sandwich Index joins Cheeseburger and Hot Dog, creating full coverage across major U.S. protein markets: beef, pork, and poultry.
For manufacturers, foodservice operators, and retailers, these movements reinforce the value of ingredient-level visibility. Rapid compression in breast prices, and its outsized effect on sandwich cost, demonstrates how a single input can quickly reshape total product costs.
Looking into early 2026, expectations point to modest firming in sandwich pricing as demand normalizes and poultry markets rebalance. As the FGI suite expands, tracking cross-commodity relationships remains essential for managing risk and making proactive decisions.
Want to see the data behind this forecast or run your own analysis? Connect with DecisionNext or access the platform today.
About the Report
The DecisionNext Finished Goods Index showcases multi-commodity finished goods cost forecasting across protein, dairy, grain, and ingredient markets (see full methodology page).
By comparing current values to 2024 averages, it helps stakeholders visualize current and forward cost pressures and profit opportunities across value-added food products. The tool enables users to forecast finished-good costs, adjust recipes, and analyze forward-looking scenarios.