Make Better Beef Decisions

Published: December 18, 2025
Markets are too volatile for procurement and sales decisions to be made without a consistent, data-driven process. Emotional reactions can be our greatest enemy, often without us realizing it.
At DecisionNext, we say, “If you do not measure, you can not improve.”
If we want to use data instead of emotion, we need a way to sort through large volumes of information and focus on the highest-value signals.
That process should begin with an accurate, transparent forecast, ideally with multiple outlooks. Whether it’s our AI and machine-learning forecast or the market-beating beef cutout forecast, forecasting distills market information from many sources into a consistent view of where prices may go.
These models process information in ways individuals, with personal biases and assumptions, cannot. But forecasts are only one part of a data-driven process. The next step is layering additional data and industry context to deepen understanding of both current market state and forward risk.
To demonstrate this, we revisit the unprecedented Choice Chuck Roll price spikes in September and October 2025. These examples show how layering data beyond a forecast can improve decisions in volatile markets.
1. Leverage Forecasts to Deepen Your Market View
The first step in building any buying or selling plan is anchoring the decision in the current price environment. Next, add consistent and reliable forecasts to distill market complexity into a clear outcome.
With DecisionNext, beef buyers have four forecast models (Cutout, Machine Learning, CME, and Fundamentals), each capturing different market drivers.
The objective is to forecast both expected price and trend so you can understand direction and risk. When multiple forecasts align, confidence increases. When they diverge, uncertainty is higher and warrants closer inspection.
One of the first steps in evaluating outlook quality is to track forecast performance, available with all forecasts provided by DecisionNext. Metrics like forecast MAPE and directional accuracy indicate which factors are driving market behavior and which model may best reflect near-term conditions.
2. Decipher the Industry’s Sold Position to Unpack Market Risk
While forecasts simplify complexity into an actionable signal, additional information can sharpen market understanding. One of the most useful is the industry’s sold position, derived from USDA comprehensive beef reporting.
Combined with forecast data, sold-position indicators broaden understanding of how supply aligns with sales and pricing.
In the near term, beef supply is mostly fixed and constantly flowing, think Lucille Ball at the chocolate factory. Product moves through the supply chain and must be sold.
To balance volume, market participants primarily use two contract structures:
- Negotiated contracts: price and volume agreed now for a set delivery date
- Formula contracts: volume fixed in advance, price determined later by formula linked to recent negotiated-market values
Formula contracts support longer-term supply commitments while absorbing market-price volatility. Most industry volume is sold on formula contracts (56% of total loads through the first eleven months of 2025), making formula participation a major component of the industry’s sold position.
With short-term supply constrained, any volume not committed under formula must clear through negotiated markets. Negotiated volume therefore reflects immediate supply-demand balance and often correlates with pricing pressure.
Negotiated contracts span different delivery horizons. USDA classifies contracts as:
- Negotiated: delivery within 21 days of sale
- Forward negotiated: delivery 22 to 90 days out
By tracking formula, negotiated, and forward volume together, an integrated sold-position view can be inferred.
For example, in Choice Chuck Roll, around 55% of weekly production is typically sold on formula, leaving 45% for negotiated channels. If forward coverage increases by 5%, future negotiated availability tightens. With the same negotiated-buyer count competing for less uncommitted volume, price pressure rises.
Table 1 summarizes sold-position metrics for the week of December 8, 2025.
Table 1. Industry Sold Position Summary (Dec 8, 2025)
| Metric | Value |
|---|---|
| Total Comprehensive Volume (loads) | 259 |
| Formula share of total | 52% |
| Forward share of total | 5% |
| Formula + Forward share of total | 57% |
These indicators should be read together. A change in formula share alone may reflect true behavior shifts or simply changing total supply.
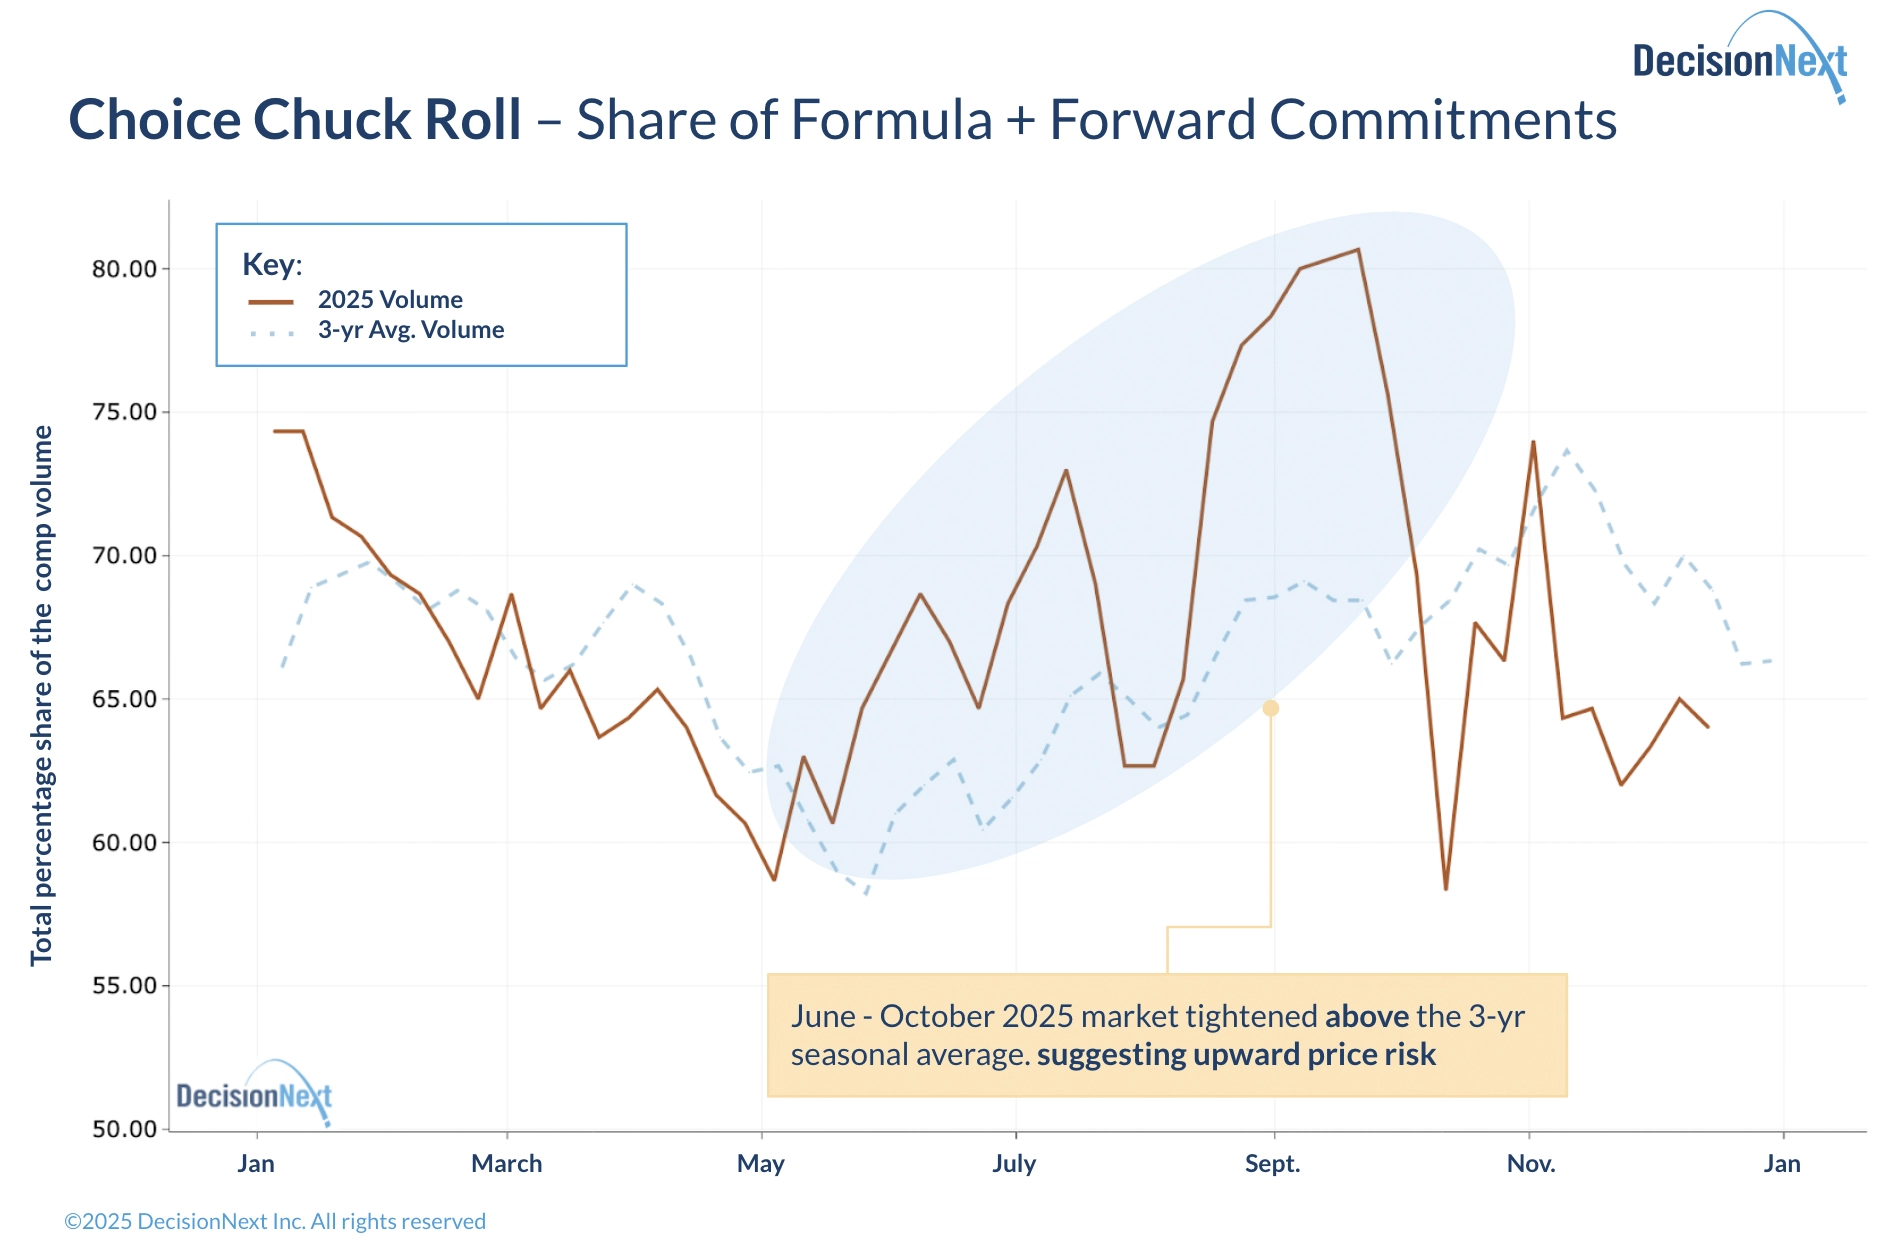 Figure 1. Share of Formula + Forward Commitments for Chuck Roll (as % of Comprehensive), compared with the 3-year average.
Looking at Choice Chuck Roll in September and October 2025, the first step is to assess how sold the industry was heading into the typical fall peak. From May to October, sold-position trends indicated a generally tightening market despite a temporary dip in August.
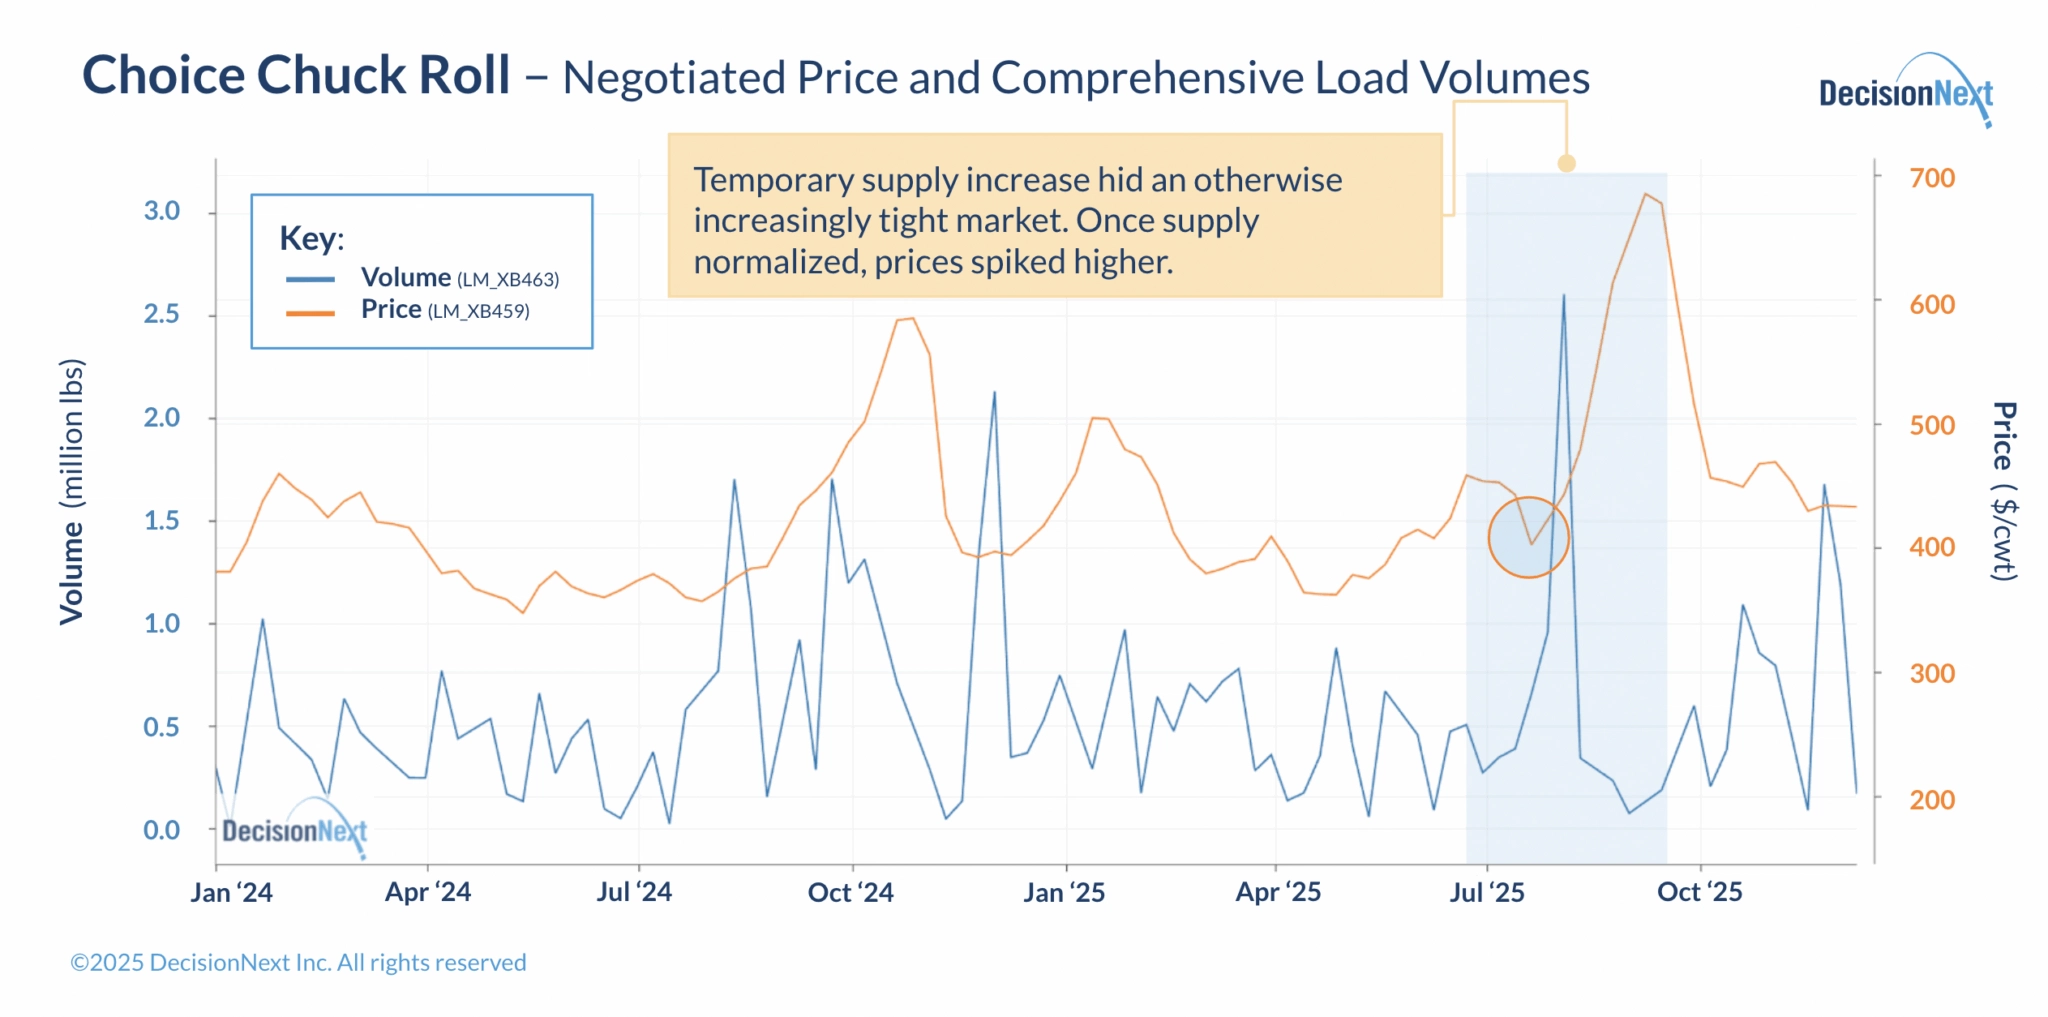 Figure 2. Choice Chuck Roll negotiated price and comprehensive load volumes.
Comprehensive volume shows a large supply increase that later faded by end-July 2025. That temporary supply expansion pressured prices despite tightening sold-position trends. When supply normalized, prices spiked as underlying tightness reasserted.
In short, sold-position data provides a behavioral overlay to forecast signals. It helps estimate whether forecasted direction is likely to unfold smoothly or be disrupted by tightening or loosening market structure.
Takeaways
DecisionNext forecasts provide a consistent and high-quality outlook for where the market may be headed. Sold-position analytics reveal how buyers and sellers are behaving beneath headline pricing.
Used together, these tools help buyers anticipate turning points earlier, time purchases more effectively, and reduce exposure to sudden price shocks, as the Chuck Roll example demonstrates.
Teams that apply this structured two-step approach gain measurable planning and negotiation advantage.