The DecisionNext Finished Goods Index | Methodology

Published: January 13, 2026
The Recipe for Better Food Cost Insight
The new DecisionNext Finished Goods Index (FGI) gives you a monthly look at the ingredient costs behind value-added food products—all benchmarked to 2025 prices. Designed for retailers, foodservice operators, processors, and industry analysts, it shows how raw material prices are changing the cost of everyday finished goods.
In addition to tracking historical cost changes, the Finished Goods Index includes a forward-looking six-month forecast for each item as well as all raw material inputs. This feature helps customers understand not only where costs have been, but where they are likely headed. So you get a more complete view for procurement, pricing, and strategy.
Skip to Cheeseburger >
Skip to Hot Dog >
Skip to Breaded Chicken Sandwich >
What Does the Index Measure?
The Finished Goods Index uses a bottom-up approach to estimate the current raw material cost behind everyday food items. Each component—beef, cheese, wheat, oil, etc.—is priced separately, then rolled up based on its share of the final product.
These composite raw-material input costs are published as an index with an average base of 100 for the year 2025 (Fig. 1). A value of 110 means the cost of this fixed basket of inputs has risen 10 percent compared to that baseline. By keeping the ingredient weights the same, this index helps customers compare price inflation across different products and see how the total cost changes.
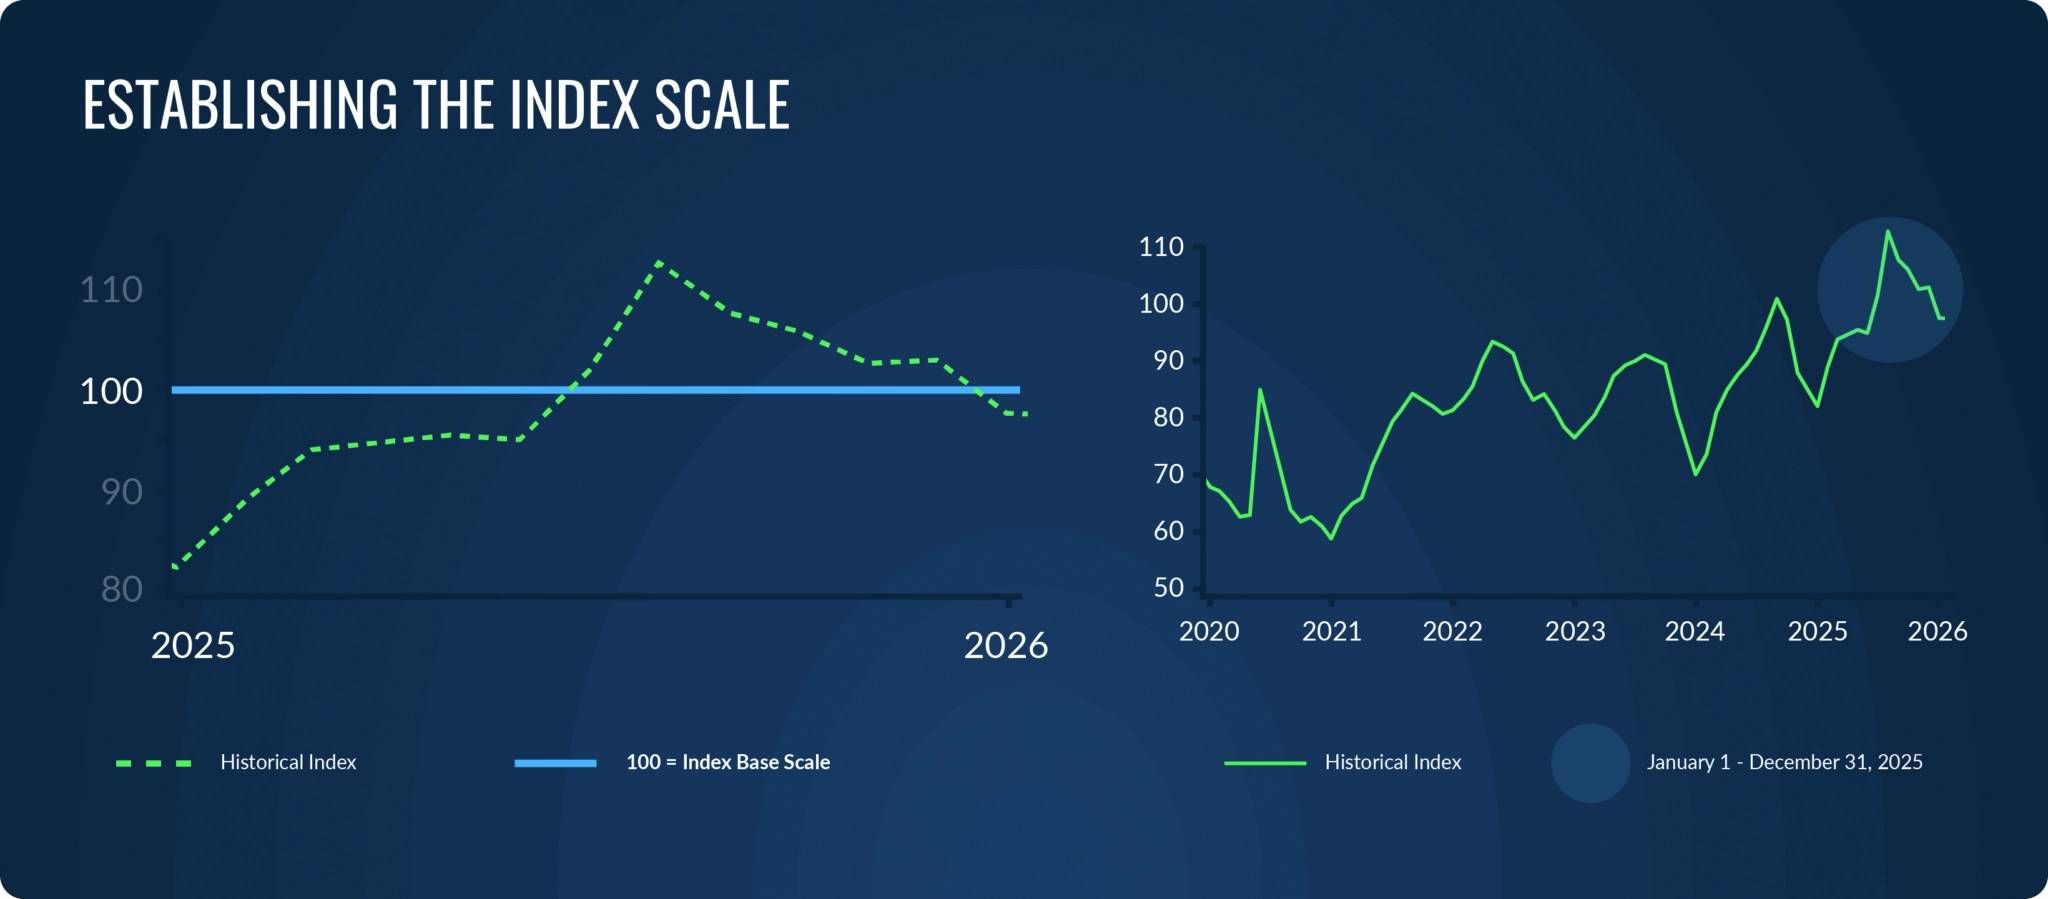 Figure 1 – Cheeseburger raw material pierce history where the input costs are indexed to 2025 average (100 = 2025 baseline).Designed to simplify complex pricing trends, the Finished Goods Index reveals which raw materials are driving cost increases by combining multiple commodity data sources into one clear series. Note: The DecisionNext Finished Goods Index includes raw material input costs only. However, the DecisionNext platform allows you to add labor, energy, freight, packaging, and other costs in order to customize the Index to your specific needs. Contact us to learn more.
Establishing the Benchmark
The index is benchmarked to 2025 average prices to reflect the most recent market dynamics. The average price for each finished good and its raw materials is calculated based on data from that year and used to benchmark the index scale (Fig. 1).
Each month, the index is updated using the most recent monthly aggregate value for the raw material inputs listed in the recipe. For stable ingredients with minimal market movement, such as salt or garlic powder, fixed pricing is used to avoid skewing the trend line.
The Secret Sauce Behind the Index
The process used to calculate Finished Goods Index value each month:
- Itemize ingredients – think of this as building the recipe and reusing it each month
- Sum total cost – each raw material input is priced separately, then rolled up based on its share of the final product
- Index result – compare the current raw material input cost cost to 2025 average (Fig. 2)
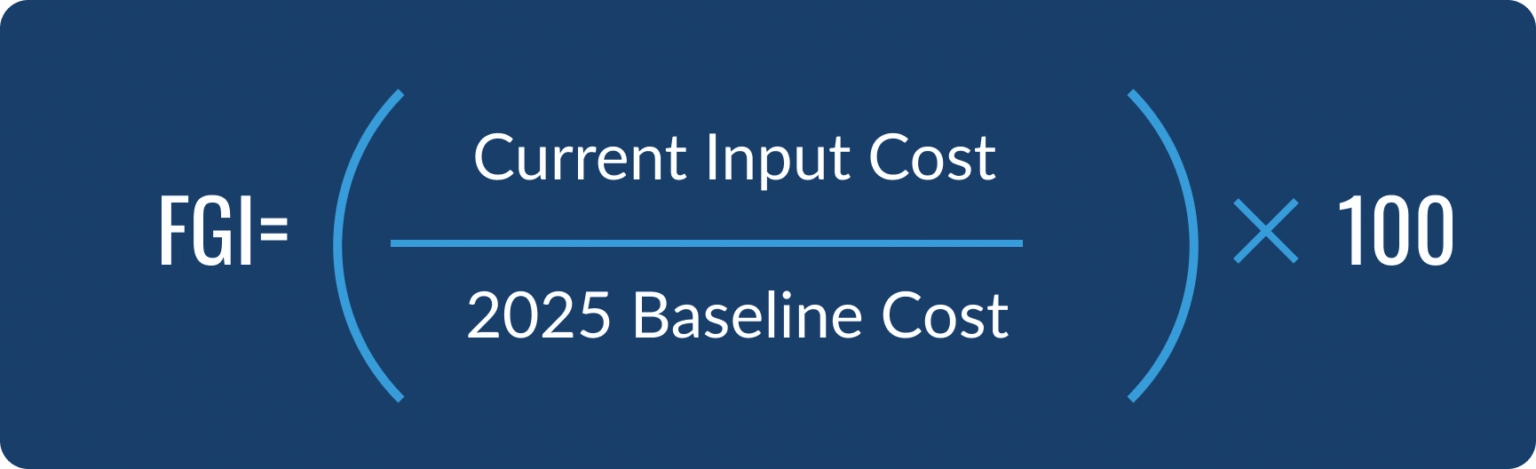 Figure 2 – The equation used to calculate the DecisionNext Finished Goods Index.
Through the Forecasting Lens
Each Finished Goods Index includes a six-month forward-looking forecast alongside historical cost trends not only for the finished good as a whole, but for each of the ingredient inputs. These forecasts help buyers and operators anticipate changes in raw material input costs and plan more effectively across sourcing, pricing, and strategy.
Like the Finished Goods Index, the forecast is built bottom-up—the cost of each of the raw material inputs listed in the recipe is forecasted on its own, then rolled into a complete forecast for that finished good. All forecasts are powered by DecisionNext’s proprietary machine learning models, which identify pricing signals from historical data. This offers a dynamic, back-testable view that goes beyond traditional forecast approaches.For more details on forecast components or to view model variants, contact the DecisionNext team.
Simple Inputs, Powerful Insight
The Finished Goods Index turns complex commodity price changes into clear, easy-to-understand signals. Whether you’re a buyer managing risk, a processor setting prices, or a leader watching costs, this tool helps you see what’s happening upstream—one finished good at a time.
The DecisionNext Cheeseburger Index
 The cheeseburger is simple, familiar, and surprisingly revealing. Made from just a beef patty, a slice of cheese, and a bun, it combines important ingredients from across the food supply chain—like *75% lean ground beef, soybean oils and hard red winter wheat for the buns, and wholesale cheddar prices for the cheese, etc. (Fig. 3). Because of this wide range of inputs from across commodity groups, it serves as a useful example for tracking changes in raw material costs.* We chose to use 75% lean ground beef in this recipe because it more accurately reflects how large-scale burger patties are actually made—using a blend of 90s and 50s trim, rather than 73% lean that comes from fed plants. This blend better aligns with the real-world sourcing used by major quick service restaurants (QSRs).
 *Ground Beef 75% (50s and 90s at 3:5 ratio) - LM_XB459: Beef Trimmings: Fresh 50% lean trimmings: Price USclb_FOB W-Sun, LM_XB460: National: Chemical Lean, Fresh 90%: Price USclb_FOB W-Sun, USDA_MARS: Cheese, 40 pound Block, CME Group - Daily Cash, $/lb, USDA_MARS: Soybean Oil, Illinois, F.O.B., Truck/Rail, Cents Per Lb, USDA_MARS: Wheat, Hard Red Winter Ordinary, US #1, Kansas City, Missouri, Terminals/Mills/Processors, $/bu, Fixed inputs (salt, spice, vegetables)
**Cost per (salt & spice, veggies)
Figure 3 – Cheeseburger recipe used for the DecisionNext Finished Goods Index.Whether you’re a retailer, foodservice operator, or a processor, the cheeseburger reflects real-world price pressures in a format everyone understands. It’s our way of turning a classic menu item into a clear economic indicator.
*Ground Beef 75% (50s and 90s at 3:5 ratio) - LM_XB459: Beef Trimmings: Fresh 50% lean trimmings: Price USclb_FOB W-Sun, LM_XB460: National: Chemical Lean, Fresh 90%: Price USclb_FOB W-Sun, USDA_MARS: Cheese, 40 pound Block, CME Group - Daily Cash, $/lb, USDA_MARS: Soybean Oil, Illinois, F.O.B., Truck/Rail, Cents Per Lb, USDA_MARS: Wheat, Hard Red Winter Ordinary, US #1, Kansas City, Missouri, Terminals/Mills/Processors, $/bu, Fixed inputs (salt, spice, vegetables)
**Cost per (salt & spice, veggies)
Figure 3 – Cheeseburger recipe used for the DecisionNext Finished Goods Index.Whether you’re a retailer, foodservice operator, or a processor, the cheeseburger reflects real-world price pressures in a format everyone understands. It’s our way of turning a classic menu item into a clear economic indicator.
The DecisionNext Hot Dog Index
 The composition of a standard hot dog makes it a powerful lens for tracking raw material volatility. Combining inputs from across the agricultural supply chain, it reflects cost pressures across multiple commodity markets. Like the cheeseburger, the hot dog serves as a compact, relatable proxy for finished goods impacted by diverse upstream price movements. Our standard recipe includes:
- 50% lean beef trimmings and 72% pork trim as primary proteins
- Soy meal, serving dual roles as filler and casing stabilizer
- Bun flour from hard red winter wheat
- Soybean oil for moisture and processing
- Milk powder and sugar for flavor and casing texture
 Beef: LM_XB459: Beef Trimmings: Fresh 50% lean trimmings: Price USclb_FOB W-Sun
Pork: LM_PK602: Trim Cuts: 72% Trim Combo: Price USclb_FOB W-Sun
Soymeal: USDA_MARS: Soybean Meal, 46.5-48% protein, Illinois, F.O.B., Rail, $ Per Ton
Wheat: USDA_MARS: Wheat, Hard Red Winter Ordinary, US #1, Central, Kansas, Terminal Elevators, $/bu
Oil: USDA_MARS: Soybean Oil, Illinois, F.O.B., Truck/Rail, Cents Per Lb
Milk Powder: USDA_MARS: Nonfat Dry Milk, Grade A, CME Group - Daily Cash, $/lb
Sugar: NYMEX: YO: No. 11 Sugar Futures: Continuous NearbyFigure 4 – Hot Dog recipe used for the DecisionNext Finished Goods Index.
Beef: LM_XB459: Beef Trimmings: Fresh 50% lean trimmings: Price USclb_FOB W-Sun
Pork: LM_PK602: Trim Cuts: 72% Trim Combo: Price USclb_FOB W-Sun
Soymeal: USDA_MARS: Soybean Meal, 46.5-48% protein, Illinois, F.O.B., Rail, $ Per Ton
Wheat: USDA_MARS: Wheat, Hard Red Winter Ordinary, US #1, Central, Kansas, Terminal Elevators, $/bu
Oil: USDA_MARS: Soybean Oil, Illinois, F.O.B., Truck/Rail, Cents Per Lb
Milk Powder: USDA_MARS: Nonfat Dry Milk, Grade A, CME Group - Daily Cash, $/lb
Sugar: NYMEX: YO: No. 11 Sugar Futures: Continuous NearbyFigure 4 – Hot Dog recipe used for the DecisionNext Finished Goods Index.
The DecisionNext Breaded Chicken Sandwich Index
 Breaded chicken is now one of the most popular—and competitive—finished goods in the food industry. Its rise across quick-service restaurants (QSRs) and retail makes it an ideal benchmark for understanding how raw material markets shape the cost of a product consumers know and love. Built from key inputs spanning poultry, grains, and oils, the Breaded chicken sandwich offers a clear window into commodity-driven cost volatility across multiple sectors of the supply chain (Fig. 5).While the Cheeseburger and Hot Dog Indexes offer insight into the red-meat complex, the Breaded Chicken Sandwich Index provides exposure to poultry markets, offering a differentiated lens into protein dynamics. At the same time, its reliance on wheat-based buns and oil-heavy cooking and breading makes it structurally comparable to other breaded and breaded finished goods widely sourced by foodservice operators. Our standard recipe reflects common build specifications used by large-scale processors and QSR chains:
- 5 oz boneless, skinless chicken breast
- Wheat flour for both bun and breading
- Soybean oil used in frying and batter/breading systems
- Fixed inputs such as seasonings, spices, and vegetables
 Chicken - USDA_MARS: Chicken, Part, Breast - B/S, Fresh, Domestic, National, FOB, Cents Per Lb
Oil - USDA_MARS: Soybean Oil, Illinois, F.O.B., Truck/Rail, Cents Per Lb
Wheat - USDA_MARS: Wheat, Hard Red Winter Ordinary, US #1, Central, Kansas, Terminal Elevators, $/buFigure 5 – Breaded Chicken Sandwich recipe used for the DecisionNext Finished Goods Index.
Chicken - USDA_MARS: Chicken, Part, Breast - B/S, Fresh, Domestic, National, FOB, Cents Per Lb
Oil - USDA_MARS: Soybean Oil, Illinois, F.O.B., Truck/Rail, Cents Per Lb
Wheat - USDA_MARS: Wheat, Hard Red Winter Ordinary, US #1, Central, Kansas, Terminal Elevators, $/buFigure 5 – Breaded Chicken Sandwich recipe used for the DecisionNext Finished Goods Index.